AWR can be helpfule to analyse below issue
The AWR can be used to identify


The AWR can be used to identify
- SQLs or Modules with heavy loads or potential performance issues. These could be from other processes than the one with reported issues.
- Symptoms of those heavy loads (e.g. logical I/O (buffer gets), Physical I/O, contention, waits).
- SQLs that could be using sub-optimal execution plans (e.g. buffer gets, segment statistics).
- Numbers of executions.
- Parsing issues.
- General performance issues, e.g. system capacity (I/O, memory, CPU), system/DB configuration.
- SGA (shared pool/buffer cache) and PGA sizing advice.
- Need to check DB time is not much greater than Available DB time

Here Available DB Time = Number of CPU * Elapse Time
= 72*60 = 4320 Min
As here DB time is 17,435 which is much greater than DB time available so here is a issue
2. Need to check DB time is not much greater than Available DB time
In above example number of session increased from 2k to 4k which is also showing issue
3. Load Profile
This is also an important section to look upon, we can figure out if there is high physical read /write , Hard parses or high rate of sql executions.

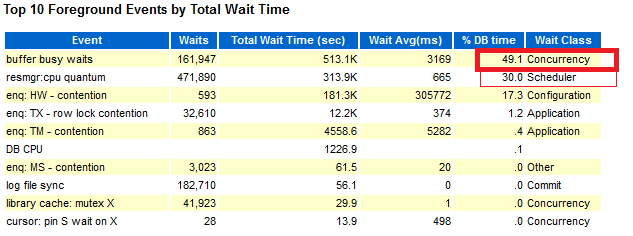
4.Check top 10 foreground event for any suspicious activity
This is very useful section of the report, Here in below example we can see ~ 80 % DB time is spent on 2 events
5. Check SQL ordered by Elapsed Time

So above two query are suspicious, we can look into execution plan of above query for more details